Printing and Measuring Test Charts
For creating printer profiles, you will need to provide characterization data, that means, you will need to print color patches on the printer using the media type and print mode you want to profile. Then, you need to measure these color patches with a spectrophotometer. An array of color patches is called a test chart.
The Print & Measure button indicates that GMG SmartProfiler requires you to print and measure.

You can click the Print & Measure button to start a new or continue an interrupted earlier measurement session. You can also click the Import button if you have previously exported a measurement file. You can click the Export button to export a completed measurement for later use. In many cases, you can click the GamutViewer button to view a completed measurement in GMG GamutViewer.
When clicking the Print & Measure button, the application will switch from the GMG SmartProfiler form to the Measurement view. Stay in the Measurement view until you have finished the measurement and then click the back button to switch back to the form and continue the profiling process. If you leave the Measurement view before you are finished, the last measurement session will be automatically saved and you can continue later.
Test charts
GMG SmartProfiler automatically creates test charts specifically for the used measuring device, the selected printer type and according to what the measurement data is needed for, i. e. printer linearization, printer color space characterization, and so on. Therefore, test charts have different layouts and sizes.
Test charts can be printed in GMG SmartProfiler from the Measurement view under Printer Color Space > Print & Measure.
- Under Measuring Device, select the measuring device that you want to use.
The test chart preview in the center changes to show the layout and color patches for your individual test chart. Depending on the test chart size and the media width of your press, the test chart might have several pages. - Under Patch Size, you can adjust the patch size to your needs.
- Under Media Size, you can adjust the media size to your needs.
Please make sure that the final test chart layout will fit on your medium. Adjust the patch and / or media size, if necessary.
- If you want to use transparent or metallic substrates, please activate the Add White Undercoat Layer checkbox.
With this option activated, a white undercoat layer is added to your test chart automatically. - Now you can choose how to proceed with the test chart PDF after its creation:
- If you want to send the PDF directly to your hotfolder's output folder and have it printed automatically, click the Printer button.
- If you want to save the PDF to a different location and print it manually later, click the PDF button.
If the press has been standing for a few minutes, we recommend you to print multiple copies of the test chart to warm the press back up again.
-
Please allow the test chart to dry properly after printing, as an ongoing drying process might affect the color results.

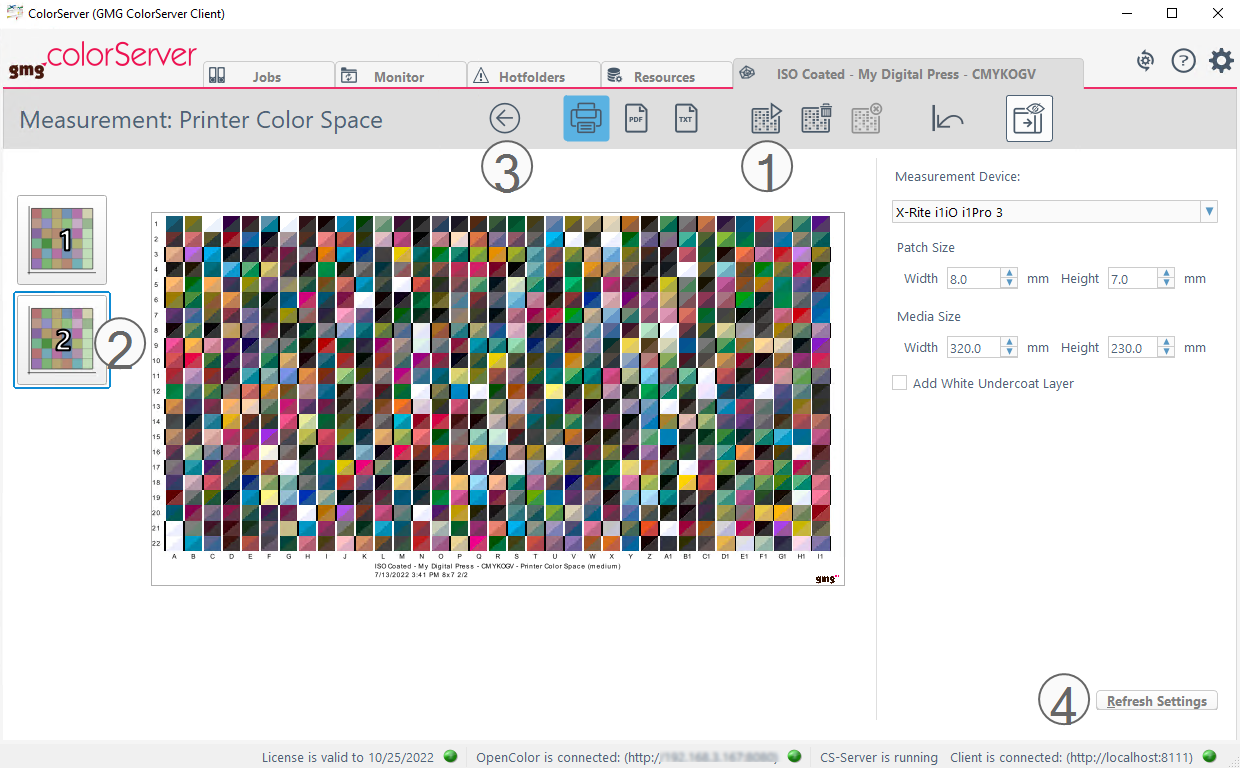
Print & Measure dialog, before printing.
If the Refresh Settings button (4) is shown instead of the measuring device settings, the connection to the measuring device has been lost. Click the Refresh Settings button to reconnect.
- Insert the printed and dry test chart into the measuring device and click the Measure button (1) to start the measurement.
The test chart preview will be updated according to the progress of the measurement session. - You can move the mouse pointer over the test chart preview to show a Patch Info with the printed CMYK values and the measured Lab and LCH values.
- In case of multiple test chart pages, you will see all pages on the left (2). Select the next page and start the measurement until all pages have been measured.
- After you have successfully measured all test chart pages and copies, click the back button (3) to accept the measurement results and to switch back to the form view.
—OR—
You can also click the back button (3) to interrupt the measurement session anytime. Click the Save or Save and Close button in the form view to save your current progress. You will be able to continue seamlessly at a later point in time.
Print & Measure dialog box, before measuring.
- You can print and measure multiple test chart copies to achieve a more reliable fingerprint of your system.
- If you want to measure the same test chart multiple times to obtain averaged measuring values, repeat the measuring procedure by clicking on the Measure button (1).
- On the left side of the Measurement view, you can expand the test chart page button (2) to select a specific measurement.
The test chart view will be updated accordingly. - You can delete the currently displayed measurement by clicking the Remove button on the toolbar.
- Click the back button (4) when you are finished.
The application will automatically average all measured values.
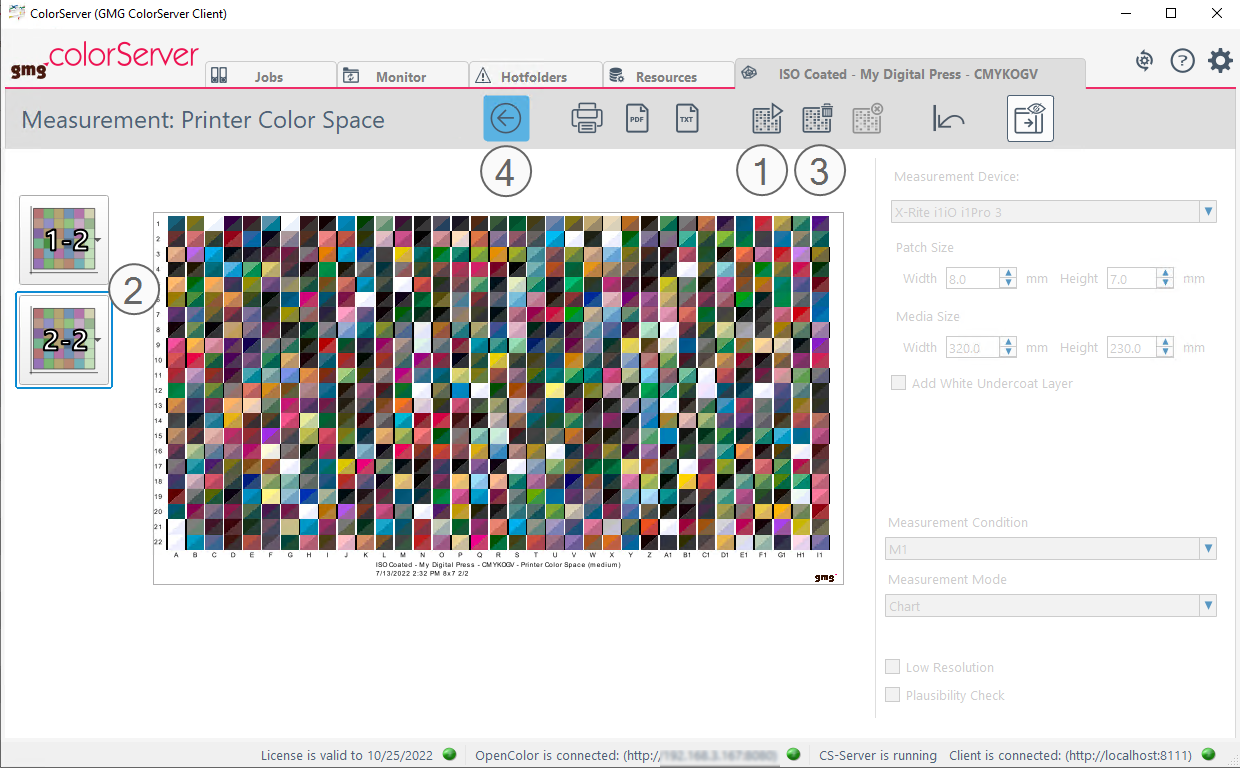
Print & Measure dialog box, after measuring two test chart copies.
The test chart page button (2) shows the number "2" to indicate that the test chart has been measured twice.
Have measurement data optimized automatically
Consistent measurement data is the key to successful and high-quality profiling. Thus GMG SmartProfiler optimizes your measurement data automatically before delivering it to GMG OpenColor: outliers are removed, single color wedges are corrected, and the data is smoothed. GMG SmartProfiler itself does not permanently store the optimized data, but keeps your original data. Please remember that if you want to manually export measurement data to a CGATS file; this manual export will only include your unsmoothed original data.
If you want to know how much your data has been improved, you can check the smoothing impact in the overview under Resources > SmartProfiler > Smoothing Impact. There are three optimization levels: Soft, Medium, and Strong. They only indicate how much GMG SmartProfiler had to adjust your data, the final quality is equally good at all three levels. However, if the level Strong is regularly applied to your data, we recommend that you check your printing process for possible weak points. For old GMG SmartProfiler projects without smoothing and for projects that have not yet been published, the status Not Available will be shown instead of an optimization level.